Top 10 Vacation Rental KPIs Every Host and Property Manager Should Track

Hosts and short-term rental management companies should make tracking vacation rental key performance indicators (KPIs) part of their routine. The good news is that it does not have to be a daily task like guest communication.
We have compiled this guide based on the real experiences of property management experts who were so kind to share their top suggestions with us. Let’s dive in and see which metrics you should monitor to ensure you are on the right path to achieving your strategic goals.

What Are Vacation Rental Metrics?
Vacation rental metrics (or KPIs) help you to track the status of specific processes that are important to hosts and short-term rental managers. From occupancy rate to net income, there are several vacation rental key performance indicators (KPIs) that will show if you are still on track to meet the goals of your rental business.
How Can Tracking KPIs Improve Your Property Management?
Keeping a close eye on key property management KPIs can help you to maintain business efficiency and growth. As they offer quantitative evidence, the decision-making of hosts and property managers will not be clouded by their own feelings. In short, tracking KPIs gives you an understanding of where you should make improvements making it simpler to reach your objectives.
What Are the Key Performance Indicators That Every Property Manager Should Monitor?
1. Occupancy Rate
To work out your occupancy rate, divide the number of booked nights by the number of available nights and multiply it by 100.
You should compare your occupancy rate to the average occupancy rate for your area. This will give you a good idea of your performance and if your pricing is correct. If it is significantly higher than the average for your area, it could be that your rates are too low.
If you manage multiple properties in different regions, it is advisable to remember that measuring occupancy rate can have some peculiarities in certain regions, as Thibault Masson, the Managing Director of SaintBarth.com, illustrates below:
“We look at occupancy rates over 10 months, not 12. The hurricane season falls in September and October, so we consider the villas closed then. These are months when we, the owners, come and conduct maintenance work.”
2. RevPar
RevPar refers to the revenue per available room. This metric is essential for every host as it gives a comprehensive picture of how you are performing financially.
To work it out, divide your gross rental revenue by the total number of available rentals for the specific period that you would like to assess. Another formula is to multiply the average daily rate by the occupancy rate.
While it is essential to monitor your occupancy rate, RevPar can give you a more comprehensive idea of how profitable you are:
“The most important KPI for Lifty Life is Revenue Per Available Room (RevPar). RevPar is a simple calculation that combines Average Daily Rate (ADR) with occupancy. RevPar creates a more complete picture than either metric alone and a better overall KPI. We use it to evaluate our performance, benchmark against competitors, and compare the performance of our properties to one another.”
Connor Griffiths, CEO of Lifty Life Vacation Rentals
3. Average Length of Stay
This metric shows the average number of nights booked by one guest. To calculate it, divide the total number of booked nights for the month by the number of bookings.
The average length of stay is vital to track as too many short stays can increase your operating costs which could make your venture less profitable.
“There are a lot of different metrics to track. Occupancy rate is most important because it determines the cash flow coming in, but it’s also important to track the average length of stay. This can impact your net operating income because short stays require more frequent cleanings. Make sure you are factoring in all operating costs when you calculate your net returns.”
Deidre Woollard, Editor at Millionacres.com
4. Average Daily Rate
This metric gives you insight into the average daily rate per property. While it can give you a good indication of your earnings potential, it is crucial to remember that it excludes your operating costs.
To work it out, divide the total revenue received from your reservations for a specific property by the total number of nights reserved.
If you use a dynamic pricing tool, Thibault Masson, the Managing Director of SaintBarth.com, explains that measuring your average daily rate is even more critical:
“We look at our Average Daily Rate to understand how our revenues are moving, especially as we use a dynamic pricing tool. Yet, for commercial reasons, we calculate our Average Weekly Rates. Luxury vacation rental management companies still quote guests based on a 7-day stay. We also use AWR to negotiate rates with our villa distribution partners and some of our guests.”
5. Net Operating Income
Your net operating income is what your property has generated after you have subtracted the expenses related to running your property, such as cleaning fees, insurance, etc.
To calculate it, take your gross income and deduct the operating expenses.
“By tracking your net operating income, you will get a more accurate idea of your expenses. If the difference between your total revenue and net operating income is significant, it might be time to examine your spending.”
Tatiana Karadjova, Operations Manager of BnbCare
6. Revenue per Property
Hosts and property managers who are in charge of multiple properties must know how much each property generates. By measuring the revenue per property, you will get a better idea of which properties are the most cost-effective.
To work it out, divide your gross rental revenue by the total number of available properties for the specific period that you would like to assess.
7. Total Revenue for All Your Vacation Rentals
Your total revenue is how much you have received from all your reservations during a specific period. This information can help you to gauge how much profit you can potentially make in the future. To work it out, add up all the costs that your guests paid (nightly rates, cleaning fee, taxes, etc.).
8. Guest Satisfaction
While there are no formulas to calculate guest satisfaction, it is still important that hosts track their rating on Airbnb, Booking.com, Vrbo. etc., and try to get as many reviews as possible by providing a flawless quest experience and asking guests for reviews.
“The other KPIs of importance are metrics that Airbnb, Vrbo, and others use to evaluate listing performance such as guest reviews, cancellation rates, and response rates. We monitor these metrics closely because they are crucial to being successful on these channels. They impact ranking and are the metrics used to evaluate Superhost or Premier Host Status.”
Connor Griffiths, CEO of Lifty Life Vacation Rentals
9. Inquiry-to-booking conversion rate
While it is great to receive inquiries, they are of no use if you do not receive any bookings. If your inquiry-to-booking conversion rate is low, it could be an indication that you take too long to respond, or your property simply does not meet the expectations of guests.
To work out your inquiry-to-booking conversion rate, you need to take the number of distinct inquiries you received and divide it by the total number of bookings for that property.
10. Average response time to an inquiry
Airbnb places a lot of emphasis on the response rate of hosts. To maintain your response rate, Airbnb expects you to reply within 24 hours. Moreover, it is one of the ranking factors on the platform.
To calculate your average response time to an inquiry, you need to add up the time it took to respond to all your different inquiries and divide it by the total number of inquiries you received.
What Tools to Use for Tracking Your Property Management KPIs?

1. Spreadsheets
By having a dedicated KPI spreadsheet with several tabs for each metric, you can keep a record of all your Airbnb metrics. Spreadsheets are easy to use and can be shared with other team members.
However, if you plan on adding a lot of data, it can become less comprehensible. Plus, as you have to enter everything manually, it requires effort and time to ensure that it is up to date with the latest measurements.
2. Airbnb reporting
Airbnb also offers some reporting capabilities. It is basically a newer version of its Performance tab. While it does not offer all the key operating metrics, it provides some valuable insights:
-
Quality
This section offers 7 metrics. Here you will find information about your listing accuracy, amenities, check-in, cleanliness, communication, location, and value.
-
Occupancy and rates
This section offers 4 metrics that will give a better understanding of your revenue. Here you will find information about your occupancy rate, cancellation rate, length of stay, and nightly rate.
-
Conversion
Earlier, this tab was called Visibility. Here you will find information about your booking conversion, booking lead time, returning guests, and wishlist additions.
-
Earnings
Here you will find how much money you have generated via bookings and cleaning fees.
-
Superhost
Airbnb’s reporting features will also tell you how you are performing with regards to its Superhost program. Here you will see information about your current status and what you need to do to fulfill the Superhost requirements.
-
Cleaning
With regards to cleaning, you will find information about the quality of your property’s cleanliness and the earnings that you have made by charging cleaning fees. The cleaning section itself is reserved for resources like checklists to help you.
3. Vacation Rental Software
Using vacation rental software with a robust reporting capability can be a real game-changer for you as a host or property manager. For example, vacation rental software, such as iGMS, gives you real-time access to the most important data and insight into your business performance.
By keeping data at your fingertips, you can save lots of time on decision-making and adjust your strategies faster. What’s more, by using automation, you can streamline your daily hosting tasks which will, naturally, have a positive impact on all your KPIs.
Pros of using iGMS
- Automated metrics tracking: The most vital metrics (such as total revenue, revenue per property, etc.) are tracked and calculated by the system automatically.
- Fast and easy access: Check your data easily whenever you need it.
- Real-time data: The data is fresh and updated regularly. Thus, you can always have a clear, current look at your KPIs.
- The ability to export data in CSV: Download your data and share it with other stakeholders (co-hosts, property owners, etc.).
- The capability of reporting to owners: If you are a property manager, you can easily invite owners to share the performance overview.
Let’s take a closer look at what insights you can find within the iGMS dashboard.
1. Monthly revenue
Where to find: iGMS Dashboard -> Reports -> Monthly Revenue Report
This report allows you to see how each of your property listings has been performing in terms of revenue during a specific month.

Other data that you can find include:
- The number of nights sold per listing
- A cleaning fee per listing
You can filter this information by account name, year, month, or property owner. With these numbers, you will be able to easily calculate your occupancy rate, average daily rate as well as other crucial metrics.
2. Essential data on all your reservations
Where to find: iGMS Dashboard -> Reports -> Reservations Report
A healthy stream of reservations is the foundation of your consistent revenue. However, it gets harder to keep track of all your reservations and details, such as cleaning and service fees or the exact number of nights booked, if you manage several properties.
With the iGMS Reservations report, you can stay on top of all your reservations per listing throughout a selected time period.

The report also shows:
- A cleaning fee amount that will go to your cleaner or a cleaning company
- Service fees
- A tax amount if Airbnb charges you as per the local law
- The number of guests and nights per reservation
- The management fee per reservation in case you hired a property manager or vacation rental management company to oversee your rentals.
Thus, the Reservation report comes in handy to provide you with the data not only on your earnings but also on essential commissions that you need to pay per booking.
By analyzing these numbers, you will be able to discover specific trends for each of your properties and see which of them attract the most bookings and yield the highest profits. These findings will also help you to identify underperforming properties and adjust your strategy to get them back on track.
3. Detailed payouts data
Where to find: iGMS Dashboard -> Reports -> Payouts Report
The Payouts Report is a great tool for simplifying your bookkeeping. The report provides a full overview of payouts that arrive in your bank account. You can put aside your long spreadsheets as all Airbnb payout transactions, as well as details of each transaction, will be registered in the dedicated iGMS report.

In addition to data on payout amounts, you will get an overview of:
- A detailed breakdown of cleaning and service fees per reservation
- A record of the date on which a transaction occurred and the type of transaction that occurred (Reservation or Payout)
- Total revenue in all various currencies that you have set up for your vacation rentals.
4. Cleaning team performance
Where to find: iGMS Dashboard -> Reports -> Tasks report
Cleanliness is one of the major components of a great guest experience. At the same time, keeping your property in tip-top condition is one of the most time-consuming tasks of the hosting routine.
It’s no wonder that most hosts hire a professional cleaner or a cleaning service to take care of property cleanliness between guest turnovers. But how would you know how your cleaning team performs without tracking their hours worked and cleaning tasks completed?
With the iGMS Tasks report, you can stay up to date on the number of cleaning tasks each cleaner has carried out and see their hours worked. Based on this data, you can easily calculate monthly payments for your cleaners.

5. Inquiry-to-booking conversion rate
Where to find: iGMS Dashboard -> Reports -> PROtrack
Inquiry-to-booking conversion rate is one of the most crucial metrics to closely monitor at the pre-booking stage.
Thanks to our exclusive add-on functionality PROtrack, you can always stay on top of this metric and maintain the productivity of your guest support team. By tracking it, you will be able to make sure that your guest support team works at its full capacity and replies promptly to any inquiries.
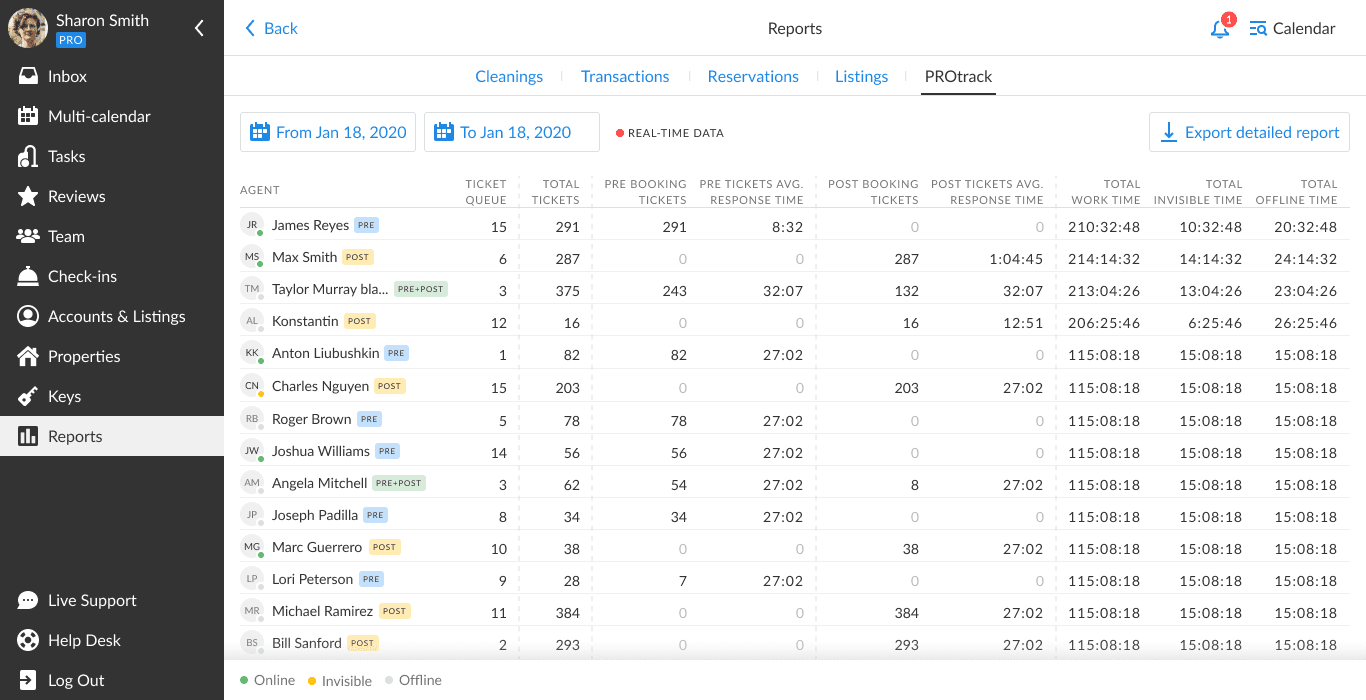
Within the PROtrack reporting, you can also monitor other important KPIs such as:
-
Average response time to an inquiry
See how prompt your guest support agents are. The PROtrack report will show how each of your support agents performs in terms of being fast and responsive. It is no secret that response time is one of the ranking factors on Airbnb and other vacation rental platforms. This is why it does make sense to measure and improve it if the current rate is on the slow side.
-
Guest communication agents’ work time
You can also track how many hours each of your support agents has worked replying to inquiries and guest requests. Within the PROtrack functionality interface, each team member is able to use Start the Timer and Stop the Timer buttons to track the beginning and end of their workday. You, as a manager, can use the report to assess each support agent’s productivity and calculate payments.
-
The number of guest dialogues handled
The PROtrack system also tracks how many tickets (dialogues and threads) have been handled by each of your support agents at every stage of the booking process. You can also see the number of inquiries in the queue. Also, if an inquiry requires your attention, your team can mark it as Pending. You can check the tickets with the Pending status to resolve the issue.
In addition to reporting and guest communication productivity tracking, the PROtrack toolkit automatically assigns agents to guest messages, ensures a balanced workload, and helps to take your guest communication to the next level.
About the Author
Olga Vasylieva is the Content and Social Media Team Lead at iGMS. Olga is on a mission to help hosts and property managers grow their businesses and deliver an excellent guest experience. She is a travel enthusiast and is inspired by life in all its aspects.

![Your Monthly iGMS Roundup [February 2020]](/content/images/size/w600/wordpress/2020/02/igms-roundup-feb-2020-cover.png)