New Dashboard: Keep Track of Your Business Metrics Easily
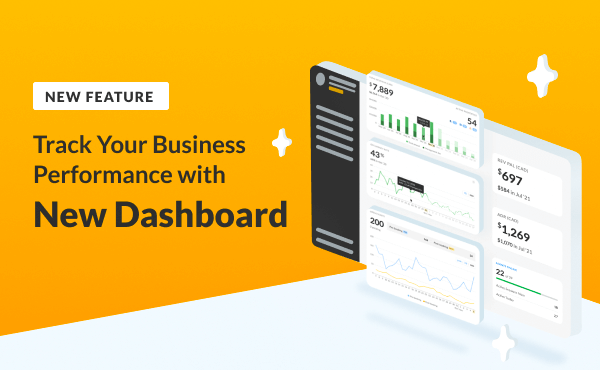
If you want to know if your short-term rental business is truly successful, it is key that you keep tabs on Airbnb metrics. This way, you remain informed about the status of specific processes that are crucial to property managers and professional hosts. It’s worth mentioning that data is gathered not only from Airbnb but also from other platforms. With the precise data at your fingertips, you can reach the decisions that serve the best interests of your business, helping you to maintain efficiency and scale. While it sounds like a mouthful, the new iGMS dashboard makes tracking these Airbnb metrics as easy as pie.
Eager to scale your business with powerful and reliable automation software? You are welcome to join iGMS right now.
What Airbnb metrics can you track via the Dashboard?
There are two types of metrics that you can track: business performance metrics and guest communication metrics.
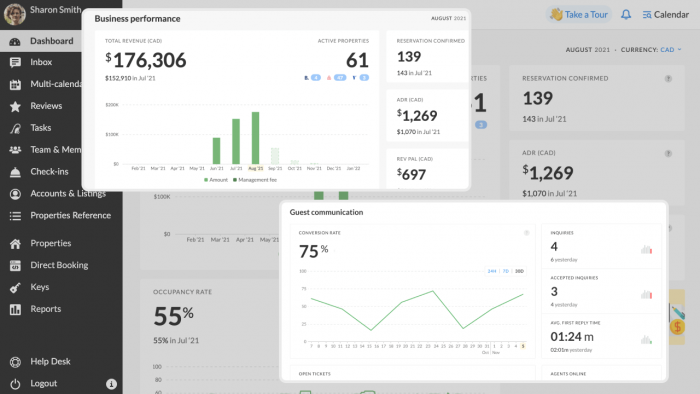
The metrics relating to the performance of your vacation rental business that you can track are:
- Total revenue in the selected currency
- Number of active properties on iGMS
- Occupancy rate
- Number of confirmed reservations for the current month
- Average daily revenue (ADR)
- Revenue per available listing/property (Rev PAL)
- Management fee
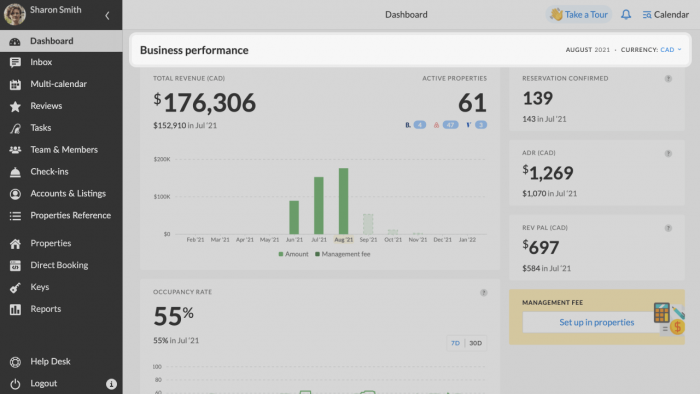
While all these Airbnb metrics are valuable, occupancy rate and Rev PAL deserve special mention. Tracking the occupancy rate will give you a better idea of how your performance stacks up against competitors in the region. If it is a lot higher compared to the average occupancy rate for your area, it can indicate that your rates are set too low.
To get a fuller picture of your financial performance, it pays (quite literally too) to keep an eye on your revenue per available listing (Rev PAL). It is even more important if you manage multiple properties as this data will help you to identify which properties are not as cost-effective. Armed with this knowledge, you can then make the necessary improvements.
The metrics relating to guest communication that you can track are:
- Inquiry-to-booking conversion rate
- Number of inquiries for the current month
- Number of accepted inquiries for the current month
- Average response time
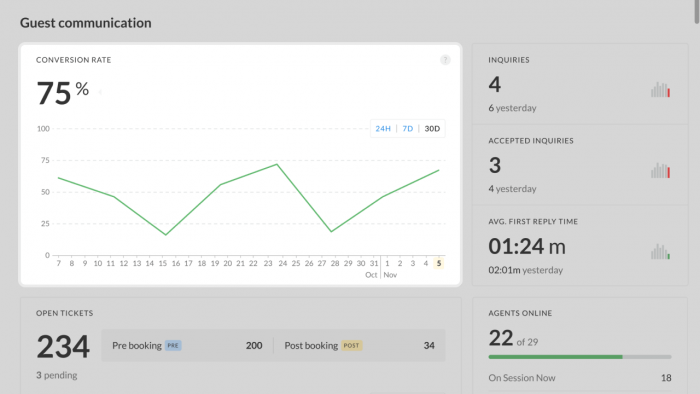
As Airbnb values and emphasizes the response rate of hosts, it is just as important that hosts and property managers use Airbnb metrics to quantify the level of their guest communication. Airbnb expects that you reply within 24 hours and uses the response rate as one of its ranking factors.
Not only is it key that you are informed about how quickly you (or your team members) respond, but it is also important that you pay attention to the inquiry-to-booking conversion rate. At the end of the day, many inquiries do not mean much if they do not regularly convert to actual bookings.
What’s more, if you also use our PROtrack toolkit, you will be able to use the new Dashboard to track the following Airbnb metrics:
- Number of open tickets that your Guest Support team is attending to at the moment
- Number of Guest Support agents available at that very moment
- Average pre-booking response time
- Average post-booking response time.
How to find the Dashboard in iGMS
You can find the Dashboard section at the very top of the main iGMS menu. If you are using our PROtrack toolkit, you will also see a dedicated section in the Dashboard with all the key PROtrack metrics. You will also be able to change the currency at the click of a button, if needed.
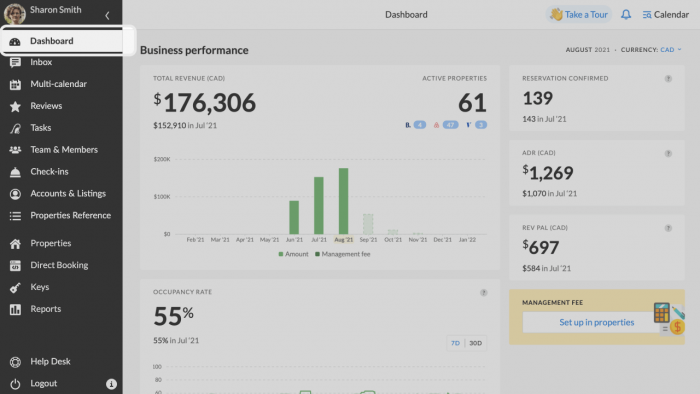
If you do get stuck, simply check the relevant tooltip next to a specific metric for an explanation on how the data were calculated. It is just another extra detail we have added to improve the user experience of our new Dashboard.
How do hosts benefit from the Dashboard?
Hosts and property managers have many tasks that require their attention. Therefore, we have designed the Dashboard section in such a manner that it enables you to stay up to speed with the most important Airbnb metrics quickly.
What’s more, it helps you to visualize the performance of your business so that it becomes simpler to draw conclusions. Though, what use will it be if the information is outdated? For this reason, we have also made sure to update the data in real time.
So, to sum up, with the new Dashboard, iGMS users will get real-time valuable data in a form that is easy to interpret at a glance.
Want to try all the iGMS tools in action? You are welcome to join our biweekly live webinars and/or sign up and start your free 14-day trial. More updates to come soon, stay tuned!


![Your Monthly iGMS Roundup [February 2020]](/content/images/size/w600/wordpress/2020/02/igms-roundup-feb-2020-cover.png)

